-
Asian Countries Rush to Stockpile Oil, Accelerate Renewables Amidst Iran War
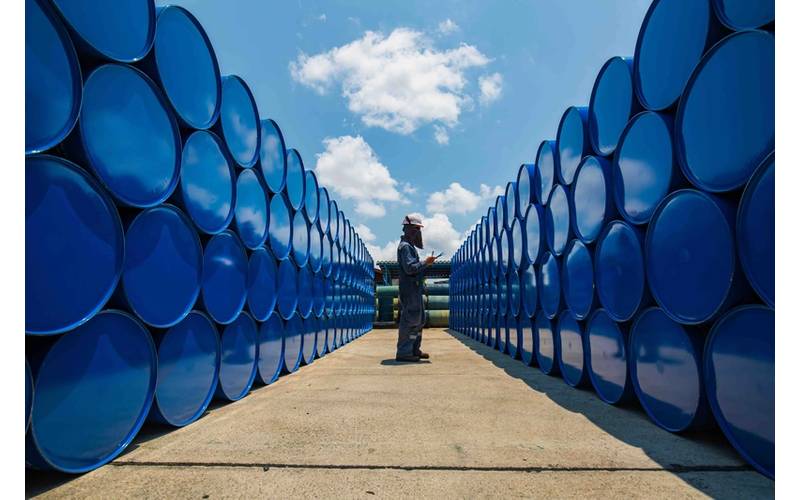
Asian countries are racing to raise their oil stockpiling capacity, complete a regional power grid and speed up renewables in response to supply risks laid bare by the Iran war.Southeast Asia has been worst hit by the energy impact as 80% of the oil transported through the Strait…
-
The Business of Offshore CO₂ Storage: A New Market for Maritime Infrastructure
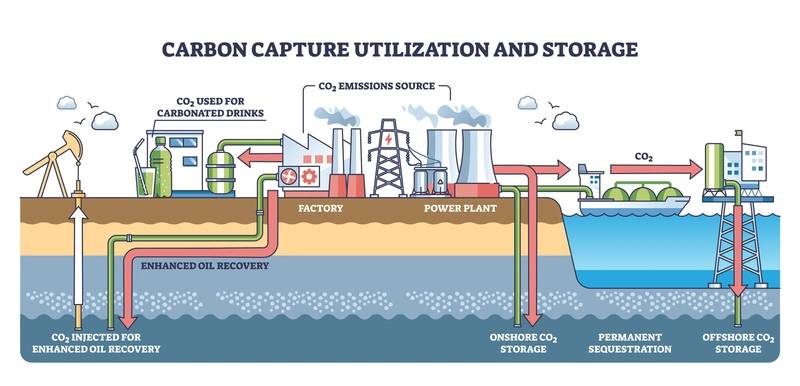
Carbon capture and storage (CCS) is moving from a collection of demonstration projects toward a new infrastructure business. As of July 2025, 734 commercial CCS facilities were in operation or development, up from 628 a year earlier, while total capture capacity in the pipeline…
-
Turkey Unveils 2040 Energy Policy Powered by Electrification
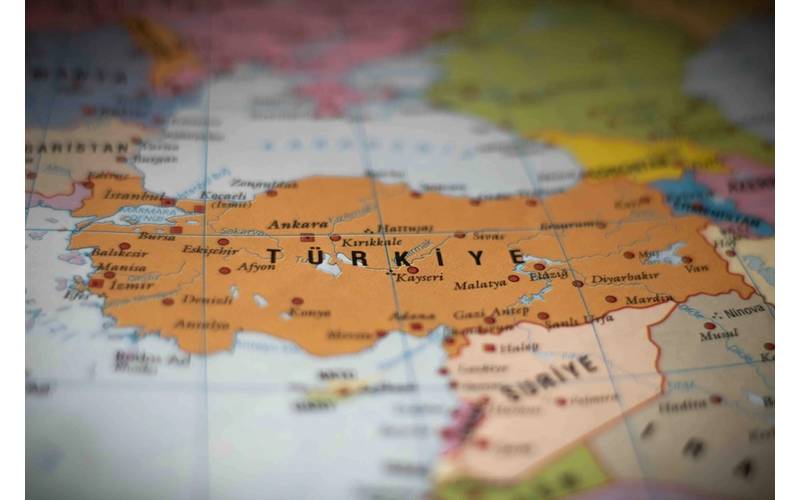
Turkey's Energy Minister Alparslan Bayraktar unveiled the country's 2040 national energy policy on Thursday, which requires $500 billion in energy investments by 2040, including more than $330 billion for electrification goals.Policy built on supply security, emissions reduction.Wind…
-
Eni to Reach Investment Decision on Mozambique FLNG Expansion by 2027

Italian energy firm Eni said on Monday it anticipated reaching a final investment decision for a third floating liquefied natural gas (FLNG) unit offshore Mozambique at its Mamba East project by 2027.The announcement by Eni's chief operating officer, Guido Brusco, followed a meeting with Mozambique's President Daniel ChapoDiscussions focused on the
-
Floating Production Outlook: Pipeline Looks Huge, But Not All Projects Are Created Equal

Global floating hydrocarbons and electricity production and storage infrastructure (floating units) has a sizeable development pipeline through 2035, but the gap between identified projects and committed work is substantial. Intelatus Global Partners tracks 711 floating units worldwide…


-
Operations for QatarEnergy LNG Expansion Project to Begin in November
The first liquefied natural gas train under QatarEnergy's North Field East expansion project will be ready to start operation in November, two people
-
QatarEnergy Purchases Long-Term LNG Supplies In Case of Future Hormuz Disruptions
QatarEnergy is buying long-term supplies of liquefied natural gas from the US and other producers as part of a trading strategy…
-
MARAD Approves Deepwater Port License for $8.2b LNG Project
The Maritime Administration has approved a deepwater port license application for the $8.2 billion ST LNG project, US Transportation…
Latest news
-
Early Saturday, Hurricane Isaias is forecast to strike the US Gulf Coast as Tropical Storm Isaias
The National Hurricane Center reported that Tropical Storm Isaias formed?in the Gulf of Mexico Wednesday. It is expected…
-
Saudi Arabia Looks to Raise Pipeline Export Capacity by 10 Million BDP
Saudi Arabia is looking to expand its pipeline crude export capacity to as much as 10 million barrels per day by repurposing a domestic gas pipeline a
-
ConocoPhillips considers selling its Norwegian business and UK Teesside assets
ConocoPhillips, a US oil and natural gas producer, said that it is considering a possible sale of its Norway operations and…
-
Glencore receives approval for the extension of Hunter Valley coal mining operations in Australia
Glencore won approval on Wednesday to continue operating its Hunter Valley thermal coal project in Australia until 2045 after…
-
French and Benelux stocks: Factors to watch
Here are some company news and stories from France and Benelux that could have an impact on the?markets in this region or individual stocks.
-
Inox Clean Energy Files for $1 Billion India IPO
Draft papers revealed on Tuesday that Inox Clean Energy filed for a public offering of up to 100 billion Rupees ($1.04billion)…
-
El Nino and record supply are affecting US natgas price this winter
Analysts said that US natural gas will be cheaper than last winter due to a strong El Nino climate pattern, which is expected to curb demand…
-
Iran demands diplomatic solution to peace after Trump rejects peace plan
I ran on Sunday and insisted that diplomacy is the only way to solve the conflict between Iran and the United States, and…
-
China's October oil throughput rate dips, data indicate crude stock build
the US-Israeli war on Iran. Bureau of Statistics on Monday. down 6.9% from a year earlier. earlier. March this year. (bcm). from a year earlier.
-
Russell: The seaborne thermal coal markets in Asia are shrinking slowly.
In the next few years, the market for seaborne coal thermal is in a slow race as a slight decline in demand competes with?an…
-
VEGOILS Palm gains strength on Dalian but still on course for a monthly drop
Malaysian palm oil futures are headed for their first monthly drop in four months, but prices have edged up a little bit after a three session slide.
-
Spain, Portugal, and Luxembourg press for 2040 EU Renewable Energy Target
In a letter that was seen on Tuesday by, Spain, Portugal, and Luxembourg urged the European Union (EU) to set a target for…